Table of Contents
MACD Full Form, MACD Indicator How To Use, MACD Crossover Screener
Hello, Friends today we will discuss MACD. MACD Full Form, MACD Indicator How To Use, MACD Crossover Screener.
MACD is one of the Leading Technical Indicator. We have already discussed the difference between Leading & lagging Indicators. MACD Indicator Help you to predict Any Stock’s Next Movement. Stock will gain or fall.
A lagging indicator is an indicator that works well over a long period of time and when a stock’s trend changes completely and tries to give us a confirmation signal. Then he is called a lagging indicator.
And MACD is one of them.
Table Content
Introduction
MACD Full Form
MACD Indicator How To Use
MACD Indicator Settings
MACD Trading Strategy
MACD Crossover Stocks
MACD Histogram
MACD For Intraday
MACD Golden Crossover
My Words
MACD Full Form
Moving average convergence divergence (MACD). Short for moving average convergence/divergence.
Created by Gerald Appel in the late 1970s.
Join Our WhatsApp Group & Get Free
Intraday Calls
******************************************************************************************************************************************************************************************************
Join Our Telegram Group & Get Free
Intraday Calls
MACD Indicator How To Use
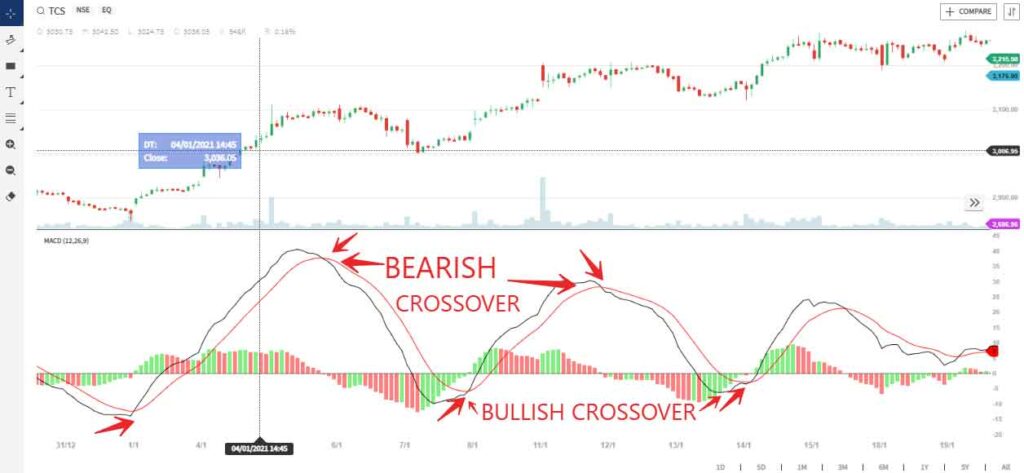
On MACD Indicator have a 2 type of line Red & black color.
The red color line is a symbol of the Bearish Trend.
Black or Green color is a symbol of Bullish Trend.
If the black color line cross over the red color line (the upside to the downside)that means the stock trend becomes bearish. In that case, stock candle movement will downside.
If the black color line cross over the red color (the downside to the upside) that means the stock trend becomes bullish. In that case, stock candle movement will Upside.
Below I have posted Bearish & bullish Cross Over Images for understanding.

MACD Indicator Settings
Fixed Setup
Fast MA Period – 12
Slow MA Period- 26
Signal Period- 09
MACD Trading Strategy
1] MACD on large time frames works well. Such as 30 min, 1hour, or 1 day.
2] MACD works well if you are trading swing or positional.
3] The MACD signals us a little late, that is when the stock is completely changing its trend and confirms to us that the stock will rise or fall.
4] Use Multiple Indicators with MACD to confirm the Result. Like Super trend or EMA.
MACD Crossover Stocks
How can you Find MACD Crossover Stocks within a minute?
Use MACD crossover screener like Chartink, top stock research Website.
Most traders are using different types of strategies; in this case, Chartink Website is very useful.
Just add parameters & scan.
Paid & free versions are available; Paid version will work on the live market & the free version working 5 min delay.
I have briefly explained how to use Chart ink in this Article. Read here…………….
Below I have updated some popular pre-ready scanner Strategies wise, just click & check it now.
MACD crossover screener (Chartink top stock research)
MACD crossover screener (Chartink Website)
Another Strategy’s pre-ready scanner
MACD Histogram
MACD histogram is an advanced feature of MACD.
It’s looking like a historical bar. 2 types of bar Red & green. When the green color bar increases that means the stock trend becomes bullish. If Red color bar increases that means the stock trends become bearish.
Below I have posted Bearish & bullish Histogram Images for understanding.

MACD For Intraday
MACD + Super Trend Combination
If on the live trading market any stock does cross means -MACD crossover + Super Trend crossover on the upside at the same time, that stock is ideal for Intraday trading & also Positional trading.
Remember in that case use time frame will be 15-30 min candles.
MACD Golden Crossover
If any stock after a long time (minimum 6 months) creates MACD crossover bullish and also stock cross 20 EMA. Guys that Position is the Golden Crossover for this stock. Through a screener, you can find this stock.
Some Important Articles
How To Get Rich In India
How To Make Money In Falling Market
Best RSI Settings For Intraday
What is Margin Trading in Share Market: Risks and Advantages
Best Time To Buy Stock- Session Wise Stock
Best LIC IPO Date, Update, Valuation, Live News on Budget 2021
What Is Stop Loss In Share Market
Stock Market Course
I have been associated with the stock market for the last four years, teaching and training in the and opening Demat & Trading Account. I am currently associated with two stock market companies. Upstox & Ventura Ltd
However, at present, I have opened my own online training center. This training center will teach you to work in the free share market for three consecutive months. Therefore, those who want to learn how to work in the Share market can contact by calling the mobile number given below or WhatsApp. To do this course, you have to be 23 years old, educational qualifications, high school, and a mobile number associated with the Aadhaar card.
Therefore those who are interested can contact you today.
Open Demat Account Join Now – Stock Market Technical Course
My Words
After all, MACD is one of the Useful Indicators. You Must try.
I hope you like my article “MACD Full Form, MACD Indicator How To Use, MACD Crossover Screener.”, Place Stop Loss Order, What Is Stop Loss Hunting” and your knowledge has increased it lot I have made a mistake in this article or if you have any questions, feel free to leave a comment in the comments box and I will try to answer your question as soon as possible.
Join Our WhatsApp Group & Get Free
Intraday Calls
******************************************************************************************************************************************************************************************************
Join Our Telegram Group & Get Free
Intraday Calls


