

Table of Contents
How to Identify Trend Reversal Candlestick Patterns In Stock Market
Friends, today we will discuss, How to Identify Trend Reversal Candlestick Patterns In Stock Market.
There are some traders who buy shares at the moment when they are moving. But sometimes it becomes very harmful.
Because getting on such a moving train is risky. It is very risky to give a hand to such a moving stock.
So when a stock is reversing, that is, from a low price to a high price or from a high place to a low price, you have to trade the shares.
This means that you can trade on that stock when it is reversing.
So the topic of our discussion today is how you understand the share is going to be reversed.
In fact, there are many types of chart patterns, with Candle & Strategies, which allow you to analyze and understand when the movement of stocks is going to change.
Hekin Ashi Candle – Doji Candle
The first is the Hekin Ashi candle.
We have already discussed Hekin Ashi candle in detail with you.
The Hekin Ashi candle produces a continuous green candle when the green Candle starts giving, and again when the first red candle starts giving, the continuous red candle is formed.
In this case, how do you understand the reverse of the shares?
In fact when the last green Candle is made the first one is made of a red candle.
A candle is made between the last green candle and the first red candle.
This candle is called Doji candle.
The Doji is a reversal candle.
So if you are using Hekin Ashi candle then you can use the doge candle as a reversal candle.
Heikin Ashi Candles, Formula | Heikin Ashi Strategies & Charts
The Second is RSI
I have already discussed in detail about RSI indicator.
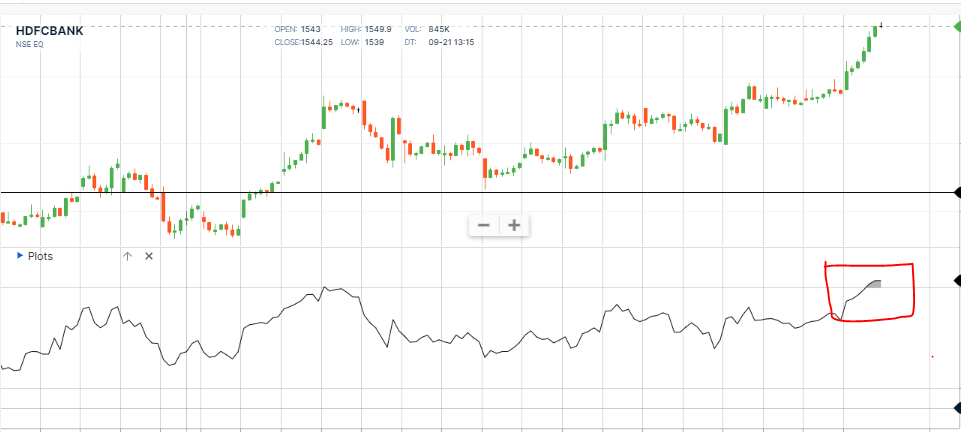
When RSI goes down to twenty levels, when he reaches the oversold zone, the shares are bought.
But you have to keep in mind that when the stock is about to reach the oversold zone, a big red candle will be formed, and there will be a wing at the bottom.
In a word, a big red hammer candle will be made. candle This is the reversal candle.
What Is RSI Divergence | Types Of Divergence | MT4 Indicator
In the case of the RSI strategy, you can follow this kind of candle.
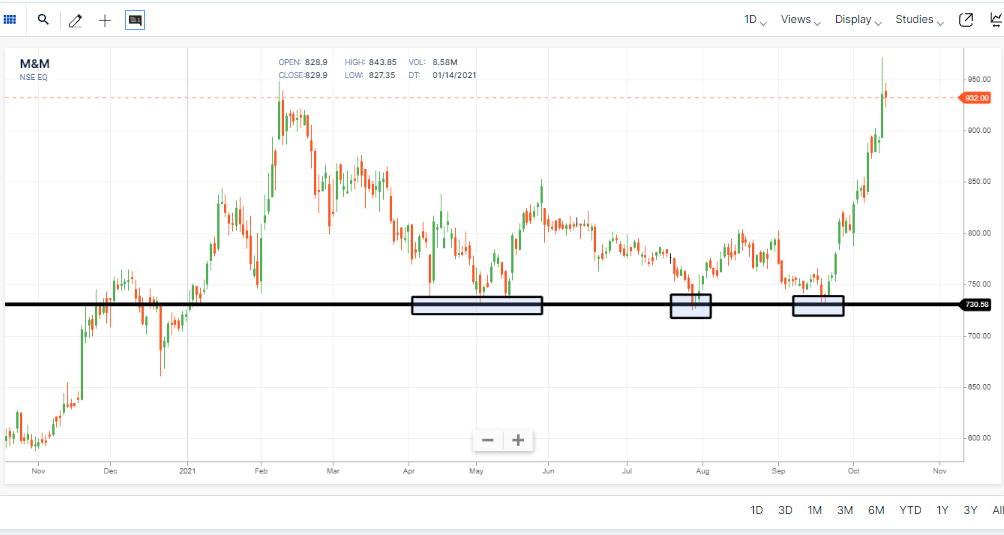
The Third is Support and Resistance
If you want to buy shares from support, first you need to see how many minutes time frame you are using.
If the stock rapidly touches the support line at an angle of 75-80, a large green or red hammer candle is likely to form near the support line.
Actually, the hammer candle introduce Rejection from the support line
And this candle is the reversal candle.

Again if the stock slowly reaches a 45-60 angle near the support line.
In that case, the reversal of that stock is subject to some time, there is a possibility that the stock will make small size of 2-3 w pattern, then there will come a time when we will see the breakout candle.
This breakout candle is a reversal candle.
Then you can safely buy shares at this breakout reversal candle.
Moving Average(EMA)
If you are working above the moving average then you need to see where the reversal candle or reversal pattern is being created.
In fact, you need to use a 4 hour, one-hour, or one-day time frame.
And only need to use 200 Ema. Always trade on Nifty 50 stock & futures Stocks.
In this time frame, you need to find some shares that are going to touch 200 Day Ema after a long few days.
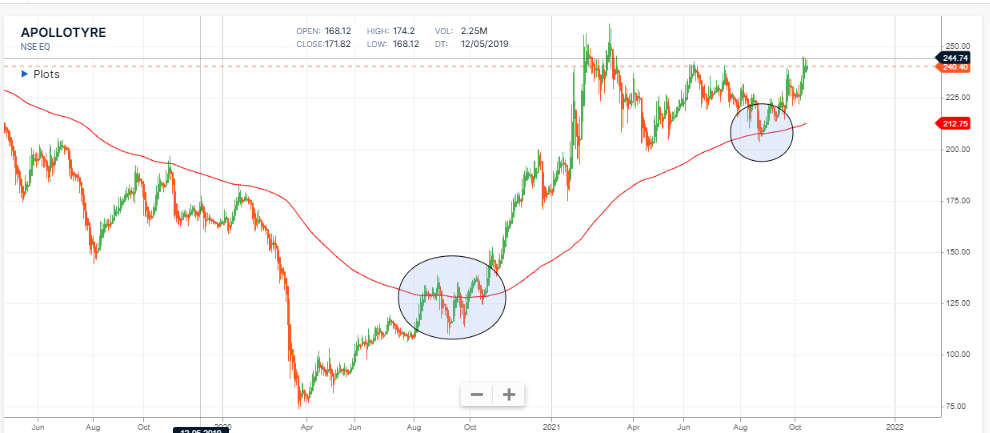
If you zoom in or zoom out, you will see an inverted U-shaped pattern.
When a stock touches 200 Emma it creates an inverted U-shaped pattern within this specified time frame.
Then you can buy shares at 200 Ema.
You can use this technique to do Swing trading and Positional trading.
Anyway friends today I have discussed with you in detail several reversal guys you can use in each method to your advantage to backtest.
Then you can use these methods professionally in the stock market.
Moving Averages Trading Secrets – Advantages & Disadvantages of Exponential Moving Average (EMA)
Important Points
- Ignore Uc & Lc touch Possibility Stocks.
- Choose share from Nifty 50 & Derivatives Stocks
- Maintain Stoploss Regularly
- Ignore Trade on NewsBased Days
- Diversify your Investment.
- Regular Practice.
Last word
I hope you find my article “How to Identify Trend Reversal Candlestick Patterns In Stock Market” If I have made a mistake in this article or you have any questions please feel free to comment in the comment box and I will try to answer your question as soon as possible.
If you do not have much experience in the stock market. And if you want to learn the workings of the stock market. Then you take us to the share-market technical course
(Intraday Trading Course) can be admitted.
You can learn all the work of the stock market for only Rs. 799 / – and you can earn good money every month from the stock market.
WhatsApp number – 8392091411