
Table of Contents
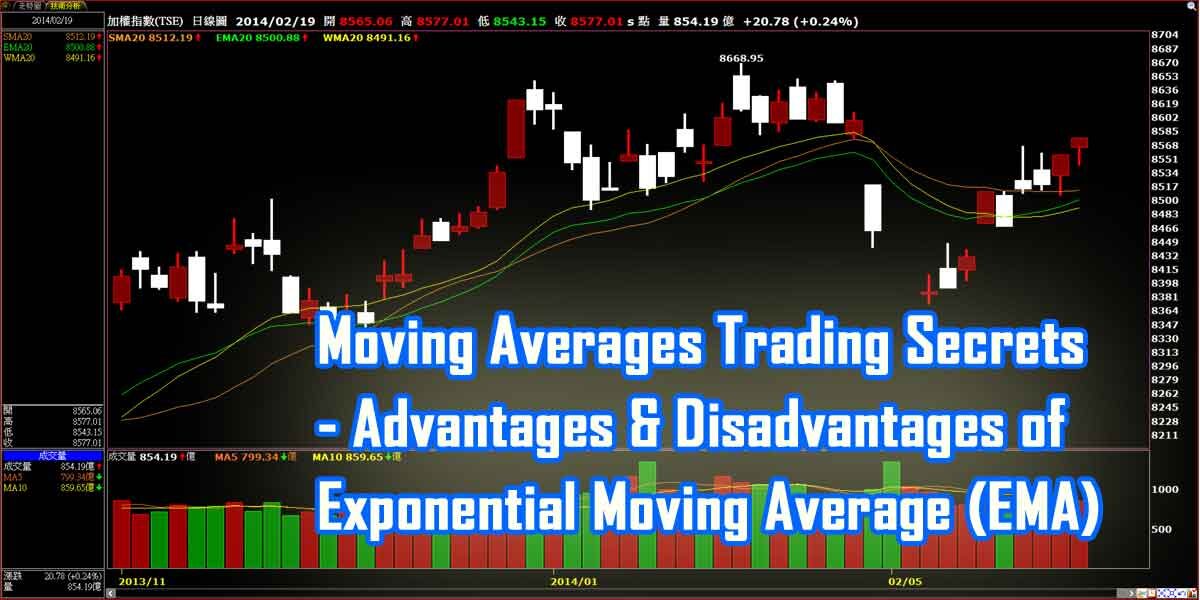
Moving Averages Trading Secrets – Advantages & Disadvantages of Exponential Moving Average (EMA)
Friends, today we will discuss the work of Moving Average. Moving Averages Trading Secrets – Advantages & Disadvantages of Exponential Moving Average (EMA)
We have discussed in detail the different types of technical indicators in our old articles. So today we will present to you a new tool.
MA – Moving average.
Many people compare Moving Average with MACD.
But moving average & MACD are different indicators or tools and working methods are different.
The main tool of Advance technical analysis is moving average. In a word, the stock market’s Brahmastra is an EMA Indicator.
Anyway, we will discuss this in detail today.
Moving Average is a technical tool that provides a variety of important information depending on the candle open price, closing price, and timeframe of the stock.
Using this information, you can predict what the next movement of the stock will be.
Table Content
What is EMA
Types of EMA
Exponential Moving Average Formula(EMA Formula)Excel
How to Use EMA on Technical Chart
Advances & Disadvantages of EMA
My Words
Moving Average is 2 type –
SMA –SIMPLE MOVING AVERAGE
EMA – EXPONENTIAL MOVING AVERAGE
Exponential Moving Average Formula Excel
EMA Calculation – If you use a 1day time frame on Tata steel (example) stock & you calculate 5 day’s EMA Price, then you have to collect the Last 5 Days Stock’s Closing Price.
For example, Tata steel stock‘s 21 Jan Closing is Price 670, So 22 Jan Tata steel 5 day’s EMA Price will be –
- Tata steel stock‘s 21 Jan Closing Price 670
- 20 Jan Closing Price 678
- 19 Jan Closing Price 689
- 18 Jan Closing Price 678
- 17 Jan Closing Price 673
670+678+689+678+673= 3388/-
3388/5= 677.60
677.60 is Tata steel 5 day’s EMA Price for 22 Jan
EMA Formula -Just you have to do calculate the Stock closing price & transform it to the Average. Remember stock time frame-wise EMA price always different. On Technical analysis, Traders use Different Different time frames & Different Periods of EMA.
Some Powerful EMA –
- 5 DAY EMA
- 9 DAY EMA
- 21 DAY EMA
- 50DAY EMA
- 100 DAY EMA
- 200 DAY EMA
On Intraday trading traders use a 5- 15/30 min timeframe, in that case, 5/9/21 EMA Work Perfectly.
Double Exponential Moving Average
Double Exponential Moving Average or Triple Exponential Moving Average
Crossover is represented as a Strong reversal of any stock. buy-side or sell-side. When 20 Days EMA crosses 50 Days EMA, that’s called Double Exponential Moving Average Crossover.
And when we see Multiple Crossover 20 to 50 & 100 or more, that’s called Triple Exponential Moving Average Crossover.
Check the below Images for a better understanding.
On positional trading traders use a 30 -60 min timeframe or a 1day timeframe, in that case, 50/100/200 DAY EMA Work Perfectly.
You don’t have to calculate EMA Manually. Just add EMA Indicator on your technical Chart.
Join Our WhatsApp Group & Get Free
Intraday Calls
************************************************************************************************************************************************************************************
Join Our Telegram Group & Get Free
Intraday Calls
How can you use EMA in trading?
As a simple word EMA works as a Resistance & Support.
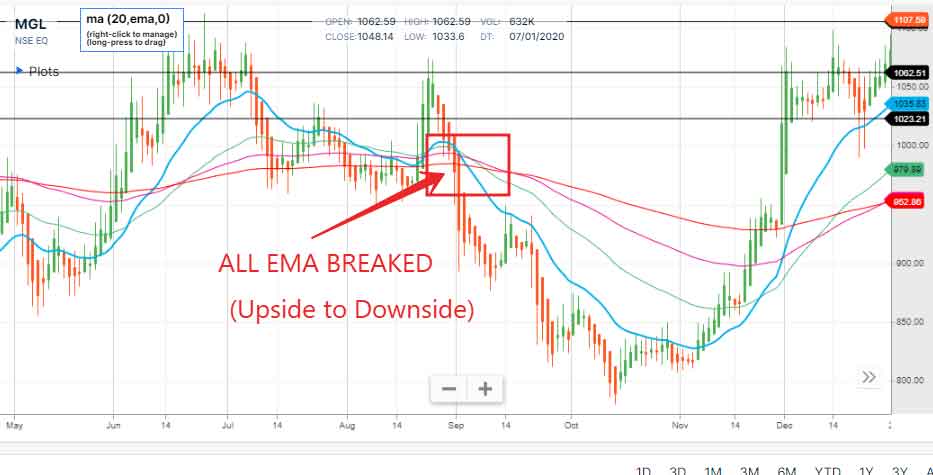
When any stock trade below all EMA or cross all EMA upside to downside. that means the Stock trend is down. In that case, don’t buy this stock. Because that’s time EMA works as a Resistance. Also, you can do a short sell on the future or option.
Now Question Is That When You Buy Stock Using EMA.
Moving Averages Trading Secrets
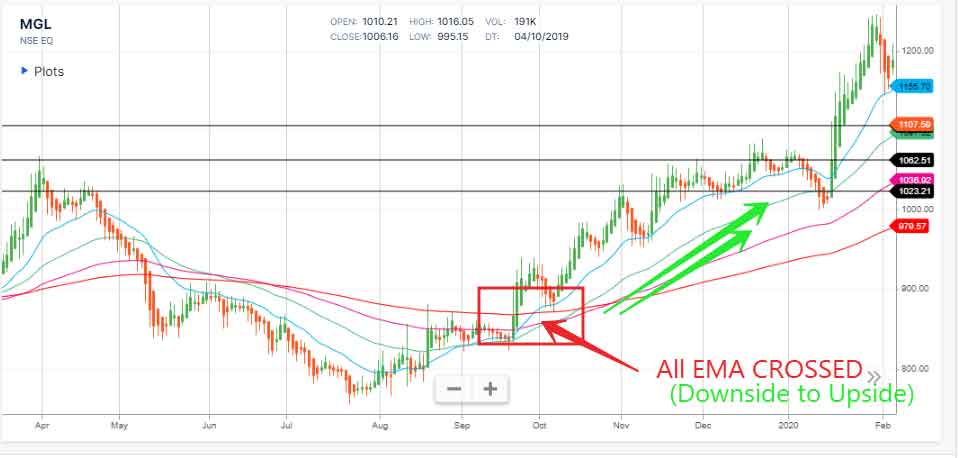
1. When stock price cross 20 day EMA Successfully (downtrend to the upside). That is the reversal point of this stock. So you can buy on this Reversal Point. Because when stock price successfully breaks 20 EMA on the upside that’s time EMA work as support.
In that case, your target will be 50 EMA if 50 EMA breaks than the next target will be near 100 EMA. So either you can decide your target. The important point is on this trading style stop-loss Price is fixed. Set stop-loss below 20 EMA.
2nd Buy Entry point is when any stock price breaks all EMA on (the downside to the upside). That’s the perfect time to enter. Because All EMA Works as a Support for this stock, EMA pushes this stock (the downside to the upside).
Check the Below images for a better understanding.
Above I have mentioned 4 MEA, 200 Day EMA is the strongest EMA from other EMA. Any stock cannot easily break 200 Day EMA.
If any Stock’s price Falling from the upside & breaks all small EMA, than 200 EMA is Godfather. Because 200 EMA is the Strongest Supporting EMA. 200 EMA will push the stock upside. So When any stock (after a long time) reached near 200 EMA, we can buy that’s the price.
Check the Below images for a better understanding.
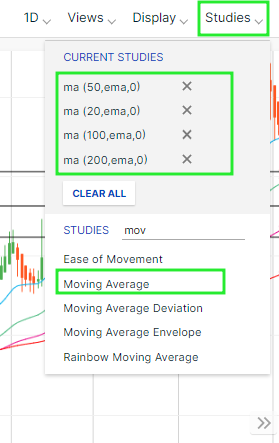
EMA Settings on Chart Pattern
Open Your Technical Chart, go to studies & search Moving Average
Now I am Want to Say Difference Between EMA & SMA
Above I mentioned both full forms
SMA –SIMPLE MOVING AVERAGE
EMA – EXPONENTIAL MOVING AVERAGE
Actually, the Difference is very simple.
Exponential Moving Average Activity is very fast, it provides us an advanced prediction.
Intraday trading or positional trading EMA works easily.
But Simple Moving Average Activity is very slow; due to slow response, SMA is not good for day trading. So use Simple Moving Average on Investing.
I hope you understand the Difference between EMA & SMA.
Join Our WhatsApp Group & Get Free
Intraday Calls
******************************************************************************************************************************************************************************************************
Join Our Telegram Group & Get Free
Intraday Calls
Advances & Disadvantages of EMA
Advantages of EMA
Moving Averages Trading Secrets – Use EMA when you can do Intraday trading and Swing trading. With EMA you can calculate how much a share price will fall and how much it will increase. And with that calculation, you can trade shares. There are some shares that follow a particular Ema well.
Such TCS follow 100 EMA well.
Cipla follow 50 EMA well
It is an example, so you have to found EMA stock like that.
SMA Is a very important role in those who buy shares for the long term.
Disadvantages of EMA
All the shares in the nifty 500 are not complied with by the EMA. During intraday training, it would be foolish to rely on EMA alone. Occasionally there is a false signal to you. So you have to verify the EMA along with other indicators.
EMA Scanner
Below I have Mentioned some Pre Scanner Link. Cust & Get EMA strategy related Best Stock List
-
Near 200 EMA Stock as a Support
-
Near 200 EMA Stock as a Resistance
-
Last 6 Months down trend Stocks
-
Bullish and Bearish Candlestick Chart pattern for Indian Stocks
Some Important Articles
The Right Time To Invest In Stock Market
How To Make Money In Falling Market
ITC Share Price Target, Forecast & Dividend Payout Ratio a day
What is Margin Trading in Share Market: Risks and Advantages
Best Time To Buy Stock- Session Wise Stock
Best LIC IPO Date, Update, Valuation, Live News on Budget 2021
Exponential Moving Average Excel
Yes, can create an Exponential Moving Average Excel page, where add Nifty 50 & Nifty 100 Stocks.
and mention 09/20/50/100/200 Day Exponential Moving Average.
That helps you choose to stock Easily.
My Words
I hope you like my article Moving Averages Trading Secrets – Advantages & Disadvantages of Exponential Moving Average (EMA), your knowledge has increased a lot. If I have made a mistake in this article or if you have any questions, feel free to leave a comment in the comments box and I will try to answer your question as soon as possible.