Table of Contents
What Is A Pivot Point? Pivot Point Calculator, Use In Intraday Trading
Hello friends, today we will discuss Pivot point. What Is A Pivot Point? Pivot Point Calculator, Use In Intraday Trading. We will discuss all these. So stay connected with us.
The pivot point is a type of technical indicator. You can get Pivot point Indicator on your Technical Chart Platform. Yet We have discussed technical indicators in detail in another article.
Read Now – Technical Indicators
Just use Pivot point to know which stock will rise or fall from which place. Let me tell you how it is possible before I tell you about Pivot point settings.
Join Our WhatsApp Group & Get Free
Intraday Calls
******************************************************************************************************************************************************************************************************
Join Our Telegram Group & Get Free
Intraday Calls
Pivot Point Calculator
You can call pivot point a kind of calculator.
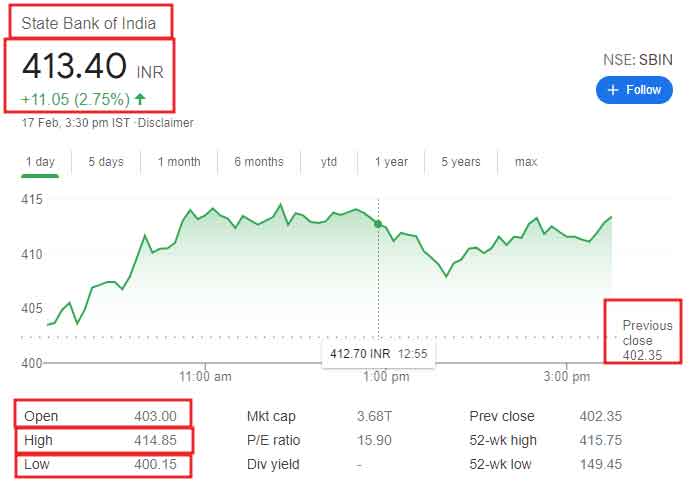
Calculations are made based on the open, high, low & closing price of the Stock candlestick.


You have to put this data on the Pivot point calculator; there as a result you can get 7 Different Level
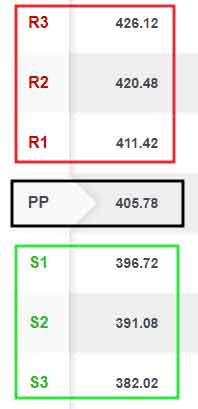
Level are – R1, R2, R3, PP, S1, S2, S3
R1 – Resistance 1
R2- Resistance 2
R3 – Resistance 3
PP – Pivot point (middle point)
S1 – Support 1
S2 – Support 2
S3 – Support 3

There are three resistances at the top of the candle between the seven levels
And below 3 support levels. There is a Pivot Point between R1 and S1.
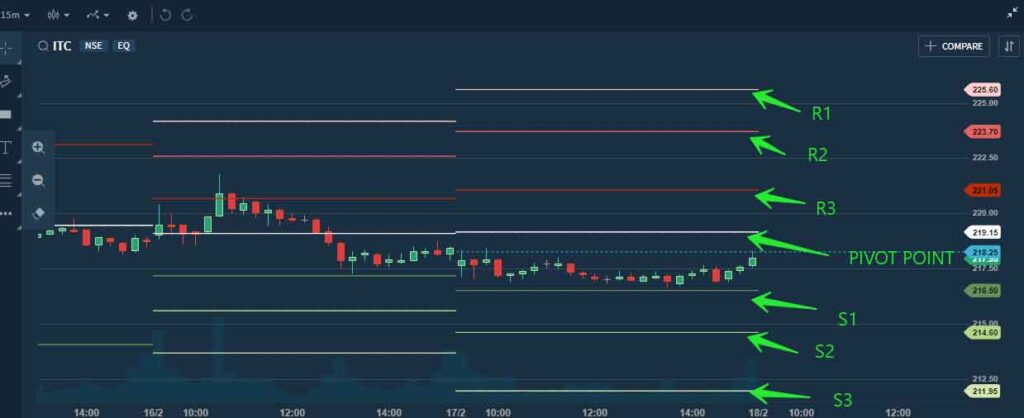
Above are some pictures for your understanding.
And I have given the link of Pivot Point Calculator, with the help of this link you can find out the Pivot Point level of the stock.
Click Here – Pivot Point Calculator
So the question is how you use the technical chart.
We have discussed support & resistance in detail in another article. But for your convenience, the present is briefly discussed.
See the work of support in the stock market is to hold the shares so that the share price does not go down.
The work of resistance is to stop the stock up move, if a stock is going up, that is, if the price is going up, then resistance is pushing the stock from the top to the bottom.
Hope you understand the work of support & resistance.
As I said above, Pivot point has 7 levels. R1, R2, R3 The work of R3 is to move the stock downwards.
I am giving you an example
If you play games on mobile, there are different types of levels in mobile level, If you Win 1st level then you transferred to 2nd level. If you Win the 2nd level then you transferred to the 3rd level, think any why you failed, then your level will be dropped from the 3rd level to the 2nd level.
This theory work on the Pivot point. If any stock trades Above R1, its 1st target will be R2. If this stock crosses R2 then the target will be R3.
Now anyhow Stock can’t stay above R3. The stock touched R3 level but can’t stay above R3; in that case stock will be fall from R3 to R2.
Now we will discuss S1, S2, and S3.
Think of any Stock break Pivot point on the downside, then this stock will reach S1, if S1 break then next supporting level is S2 & next is S3. If the stock does not break the S2 or S3 level, then the stock will reverse upside.
I hope you understand this whole strategy.
Now Question is that how can you implement Pivot point on live trading.
Simple, remove all indicators only add Pivot point on a technical chart. Now add stock & check the current level there stock stay, If the stock stay above the Pivot point or any resistance then the target will be above resistance. If trade below the Pivot point then the stock will fall up to S1, S2, S3.
But let me tell you, the Pivot point level is created depending on the different time frames of the candle. You will need to use different time frames depending on the trading strategy. If You want to use Pivot point on Intraday trading, a 15-30 min candle is good.
Also, you can calculate Nifty Pivot Point & Mcx Pivot Point
Some Important Articles
How To Get Rich In India
How To Make Money In Falling Market
Best RSI Settings For Intraday
What is Margin Trading in Share Market: Risks and Advantages
Best Time To Buy Stock- Session Wise Stock
Best LIC IPO Date, Update, Valuation, Live News on Budget 2021
Stock Market Course
I have been associated with the stock market for the last four years, teaching and training in the and opening Demat & Trading Account. I am currently associated with a Upstox stock Broker company.
However, at present, I have opened my own online training center. This training center will teach you to work in the free share market for three consecutive months. Therefore, those who want to learn how to work in the Share market can contact by calling the mobile number given below or WhatsApp. To do this course, you have to be 23 years old, educational qualifications, high school, and a mobile number associated with the Aadhaar card.
Learn details – Intraday Trading Tips
If You Don’t Have Much Experience About Stock Market. And If You Want To Learn The Working Of Stock Market. Then You Can Enroll In Our –Share Market Technical Course.
You Can Learn All Workings Of Stock Market In Just Rs 799/- And You Can Earn Good Money Every Month From Share Market.
WhatsApp No – 8392091411
My Word
We hope you enjoy the article “What Is A Pivot Point? Pivot Point Calculator, Use In Intraday Trading” and that you have come to the right place. If there are any mistakes in this article, or if you have any questions or concerns, don’t forget to let us know in the comments box.
Join Our WhatsApp Group & Get Free
Intraday Calls
************************************************************************************************************************************************************************************
Join Our Telegram Group & Get Free
Intraday Calls


