
Table of Contents
Best RSI Settings For Intraday
Hello friends, today we will discuss Best RSI Settings For Intraday Trading, a few days ago I wrote a detailed article on Technical Analysis, you can click on this link for details.
RSI Full-Form – Relative Strength Index
Sub Heading – RSI An indicator that gives a certain number of numbers based on the movement of any stock and its levels, that number helps us to find the best stocks.
In the stock market, you will find different types of indicators but the oldest and simplest of them is RSI.
This indicator is used not only in the Indian stock market but also in the foreign Stock Market.
You will see that all major investors and traders are using this indicator in COMPULSORY technical charts.
If you can use this indicator well then a 75-80% Success Ratio will give you, however, if you add one or two indicators then your Success Ratio will be 90% ++.
Table Content
Introduction of Rsi Indicator Strategy
How to plot RSI on Technical Chart
What Is OVER BOUGHT ZONE
What Is OVER-SOLD ZONE
Best RSI Settings For Intraday
How to find out Overbought & Oversold Stocks?
How to see the RSI value of many stocks at the same time?
Rsi Indicator Strategy Usage Rules
My Words
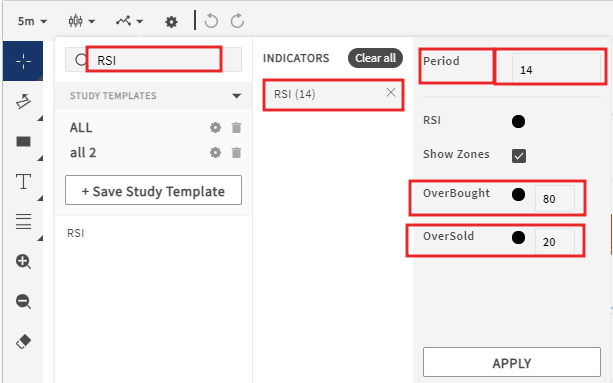
How to plot RSI on Technical Chart
Open your Technical Chart, their indicators list will be shown, search RSI(indicators list placed on a different location of broker’s technical chart)
- RSI – Indicator when you put in your technical chat. Here you can see 2 lines & also show numbers from 0 to 100.
The two options on the side will show you.
Settings are
OVERBOUGHT & OVERSOLD
OVERBOUGHT NO – 70
OVERSOLD – 30
PERIOD – 14
- also you can Include rsi divergence & stochastic rsi for a better performance.
What Is OVER BOUGHT ZONE
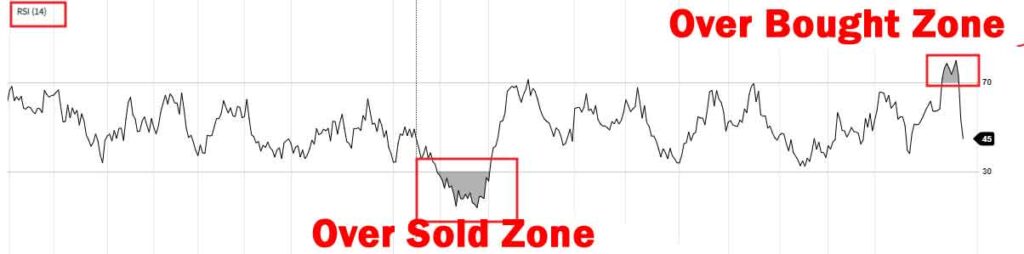
OVERBOUGHT means Stock Overvalue Price
That is when the price of a stock rises very fast and the price of the stock reaches an extreme level, I will call that condition of the stock OVERBOUGHT.
Their SELLERS start coming in that OVERBOUGHT zone, and sellers expect stock prices to continue to fall, especially for those who sell short.
The question is how do we know which stock has reached its OVERBOUGHT ZONE?
As I said numbers from 0 to 100 will show you the RSI, when a stock exceeds RSI NO – 85+, we understand that the stock has reached the OVERBOUGHT ZONE.
and from there the high chances of the stock falling downside.
I am giving you an example.
Just think CESC Stock Current price 545, RSI Level 62
(RSI Level check from Rsi Indicator Strategy).
IMAGE
Suddenly stock price start to Increase nonstop for any reason, CESC move 545 to 580+
Now if you check Rsi Indicator Strategy Level that may be showing 80-85 level. That means stock reached OVERBOUGHT ZONE. Now High possibility of stock fall from 580/-
You can Short Sell near 580 with a Small stop-loss.
Join Our WhatsApp Group & Get Free
Intraday Calls
************************************************************************************************************************************************************************************
Join Our Telegram Group & Get Free
Intraday Calls
What Is OVER-SOLD ZONE
OVERBOUGHT ZONE means Underrated or cheapest stock Price.
This is the opposite of OVERBOUGHT ZONE.
when a stock moves closer to the lowest price, that is excessive share price falls, then the situation is called OVERSOLD ZONE, and buyers start buying shares in that zone.
How do I know stock reached OVERSOLD ZONE?
You will notice the Rsi Indicator Strategy when a stock RSI level will move between rsi below 30 levels, you can understand that the stock has entered the OVERSOLD ZONE, and there is an opportunity to buy the stock, which will be able to target you within minutes.
EXAMPLE
Suddenly stock price start to decrease nonstop for any reason, CESC fall from 545 to 510
Now if you check Rsi Indicator Strategy Level that may be showing rsi below 30 levels. That means stock reached OVERSOLD ZONE. Now High possibility of stock up-move from 510 prices.
Best RSI Settings For Intraday
RSI Overbought settings will be 80-85
RSI Oversold settings will be 15-20
PERIOD will be – 14
Save it. It is the Best RSI Settings For Intraday & Positional Stocks find out.
Open your technical chart & set it fast.
How to find out Overbought & Oversold Stocks on Rsi Strategy?
There are many SCANNERs and APPs that allow you to find such shares in minutes.
NSE INDIA
First of all, enter the NSE INDIA website (old site) – live market – Equity Stocks
You will get 50 shares of nifty 50 in Equity Stocks. You will get a list of the stocks that have fallen the most and the stocks that have raised the most.
Chartink.com
This is a screener site, where you can put filters at any time you can find overbought& oversold Stocks within a second.
I have briefly discussed another article Chartink Scanner, just click & read. How to add filters & get bought & oversold Stocks list.
Economic times
Some another filter
https://economictimes.indiatimes.com/markets/stocks/stock-screener/GARP
Also, you can Install a Mobile Application for RSI Stock
Mobile App *******************************************
How to see the RSI value of many stocks at the same time?
Yes, you can see the RSI value of many stocks at the same time. Use the Upstox technical Chart, where you can search 4 different stocks RSI Value also you can Include rsi divergence & stochastic rsi.
Also, you can get the Overbought & Oversold Stocks list within a min on a lower timeframe, use Upstox Another Famous Platform – Dartstock.
Upstox Read How Can you use Dartstock
Rsi Indicator Strategy Usage Rules: –
• The correct time to use RSI RSI Strategy is from 10.00 am to 1.30 pm, although this time is not an obligation I tell you, when you buy any stock using Rsi Indicator Strategy, the result is better if you buy it at 10 am and many will exit between 1.30 pm because of the market after two. Closing time comes which makes the market move faster; if you use Rsi Indicator Strategy before 2 pm then the chances of loss increase.
• 2. The second thing is that you are buying or selling the stock, you have to see if there is any result or meeting news of that stock on that day, if there is anything like that then doesn’t touch that stock on that day.
• 3. On Intraday trading always use 10-15 min Time frame & Delivery Trading 30-60 min Time frame.
• 4. The 4th thing is to always try to buy Large-Cap stocks, as these stocks have high volume and high liquidity which makes trading easier. Volume minimum must be more than two million.
Small-Cap & High Beta Stock is very risky.
• 5. Market conditions – Before buying a stock, make sure that it is Nifty Rsi positive or negative.
If it is positive, buy shares and if the market is negative, sell.
How can I understand Market is positive or negative?
• 6. Bad luckily if a stock has moved to or near the Upper Circuit & Lower Circuit, do not touch it as it may cause you huge losses.
• The 7th thing is to occasionally refresh or log out your trading software, which will help you get the right data.
Using some more indicators along with RSI Strategy can bring better results
Moving averages, support, and resistance, MACD, Nifty Rsi
hekin ashi candle.
Learn details – Intraday Trading Tips
If You Don’t Have Much Experience About Stock Market. And If You Want To Learn The Working Of Stock Market. Then You Can Enroll In Our –Share Market Technical Course.
You Can Learn All Workings Of Stock Market In Just Rs 799/- And You Can Earn Good Money Every Month From Share Market.
WhatsApp No – 8392091411
My Words –
I hope you like my article What Is RSI Divergence? Use RSI Indicator Strategy & Nifty RSI and your knowledge has increased it a lot.
If I have made a mistake in this article or if you have any questions, feel free to leave a comment in the comments box and I will try to answer your question as soon as possible.
Join Our WhatsApp Group & Get Free
Intraday Calls
************************************************************************************************************************************************************************************
Join Our Telegram Group & Get Free
Intraday Calls